


U.Today - 11/3/2025 12:11:27 AM - GMT (+0 )


Advertisement
The market is experiencing a severe lack of liquidity and volatility. Extremely low volumes on XRP, Shiba Inu and Bitcoin confirms that the market is not interested in providing more liquidity, and the more likely outcome for those assets would be stagnation rather than a move in a certain direction.
XRP must brace itselfA death cross pattern, which frequently precedes protracted downtrends, has resurfaced on XRP’s daily chart, putting it under bearish technical pressure once more. The asset’s declining momentum, following multiple unsuccessful breakout attempts over the previous few months, is highlighted by the crossover, which happens when the 50-day moving average falls below the 200-day moving average.
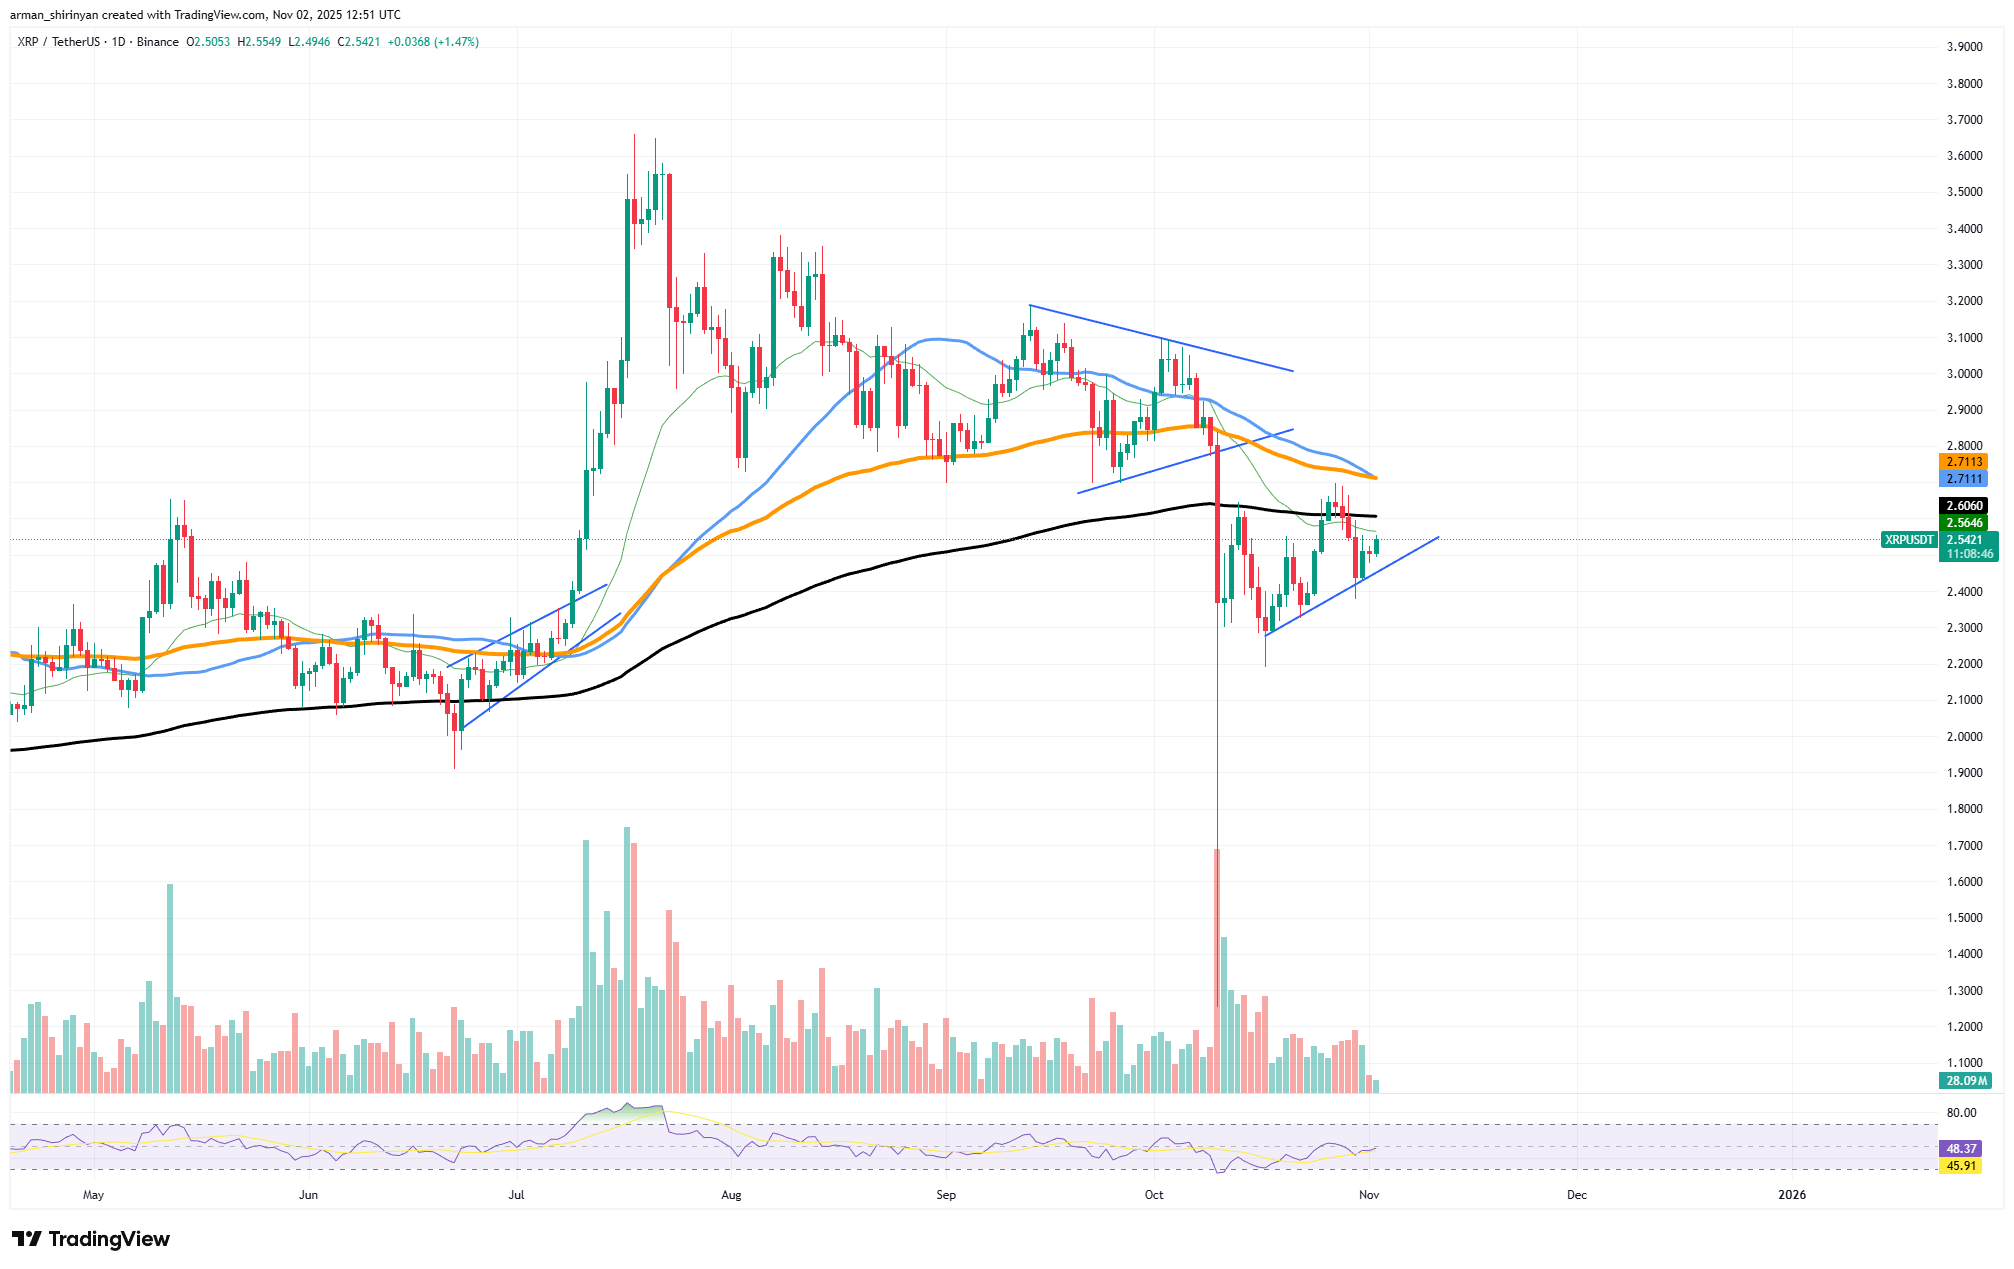
With price activity consolidating within a narrowing ascending triangle, XRP is currently trading around $2.54, perilously positioned between important resistance and support levels. The 200-day and 100-day moving averages are located close to $2.70-$2.80, creating a strong resistance area that has continuously rejected any push upward.
HOT Stories
In the meantime, there is little structural support from the 200-day moving average below price, indicating that the token is nearing its next big move. In comparison to earlier in the year, volume is still muted, indicating that traders are awaiting direction confirmation.
Advertisement
A neutral sentiment, neither oversold nor overbought, is also indicated by the RSI around 48. However, historically, death cross formations have tipped this balance in favor of bearish outcomes when combined with low momentum and waning interest.
The setup supports a downward continuation toward $2.35 or even $2.10, both of which served as significant historical support levels, if XRP is unable to break above $2.80. A successful push above $2.80 might disprove the bearish crossover and pave the way for a $3.00 retest; however, this would necessitate a noticeable increase in buying pressure.
Ethereum hints at reversalAfter months of slow underperformance, Ethereum's long-term setup against Bitcoin is starting to show indications of a possible reversal. Although Ethereum has lagged behind Bitcoin for a large portion of the year, current technical trends indicate that things may be about to change and the ETH/BTC ratio may soon rise. The ratio is currently trading at 0.035 BTC, slightly above its 200-day moving average.
Since the middle of the year, this level has frequently served as a solid structural support, averting more serious breakdowns. ETH/BTC has developed a tight consolidation pattern on the daily chart, contracting between the 200-day and 100-day moving averages.
You Might Also Like
Such periods of low volatility in this pair have historically preceded major directional shifts, frequently in favor of Ethereum, during more extensive market rotations. In the meantime, ETH/USD has stabilized at $3,890, staying above the crucial $3,600 support and making an effort to return to $4,000. Capital rotation into altcoins could occur if Ethereum gains traction while Bitcoin consolidates close to resistance levels, creating the ideal environment for an increase in the ETH/BTC ratio.
Ethereum is neither overbought nor oversold, according to the RSI near 44, so there is potential for growth if buying pressure increases. A more ambitious target at 0.0405, which would represent a 15% move from current levels, comes after the next resistance for ETH/BTC, which is located around 0.037-0.038.
Essentially, renewed institutional interest in staking yield and growing expectations for Ethereum network upgrades may be the catalyst for such an advancement. The ETH/BTC pair is essentially resting on a coiled spring configuration.
Shiba Inu's questionable outlookSHIB, which is currently trading at $0.0000102, has been unable to sustain even slight bullish momentum because it is caught between unrelenting overhead resistance and fading support. The overall situation is still dire. For months, the token has been trapped in a declining channel that has continuously produced lower highs and lower lows.
The 100-day and 200-day moving averages, which are currently at $0.0000113 and $0.0000128, respectively, are important resistance levels that have not been broken by even short recovery attempts such as the most recent bounce from $0.0000090. These moving averages have essentially taken on the role of dynamic ceilings containing price movement and stifling sentiment.
You Might Also Like
Volume conveys a similarly depressing message. Since mid-October, trading activity has drastically declined, indicating a decline in interest from both retail traders and speculative investors. SHIB's price movement has lost volatility in the absence of participation and liquidity, which may sound stable but typically signals future declines rather than recoveries.
The RSI is currently at 45, indicating stagnation rather than bullish or oversold conditions. From a technical standpoint, this puts SHIB in a risky situation because there isn't any genuine buying interest to push prices higher, but there isn't any panic selling to change the market structure either.
A decline toward $0.0000075, the next significant support level, could be triggered by a breakdown below $0.0000090. Essentially, the ecosystem surrounding Shiba Inu has also cooled. New use cases have not emerged on a significant scale and burn events and project updates have not succeeded in rekindling enthusiasm.
read more