


AMBCrypto - 4/19/2024 4:02:37 AM - GMT (+0 )

- LINK and MATIC have witnessed consecutive declines in the past few days.
- Holders are currently holding at a loss due to their price declines.
While Chainlink [LINK] and Polygon [MATIC] may appear unrelated at first glance, their rankings on the market capitalization chart exhibit similar patterns.
Furthermore, examining their MVRVs (Market-Value-to-Realized-Value ratios) and Open Interest reveals similar trends.
Chainlink and Polygon’s market capAccording to data from CoinMarketCap, Chainlink and Polygon are currently ranked 16th and 17th in terms of market capitalization volume.
At the time of writing, the market cap of LINK stood at approximately $7.7 billion, while MATIC’s was around $6.5 billion.
Notably, LINK had experienced a nearly 25% decrease in value at the time of writing, and MATIC was in a comparable range. This price movement has drawn attention to the current profitability of holders.
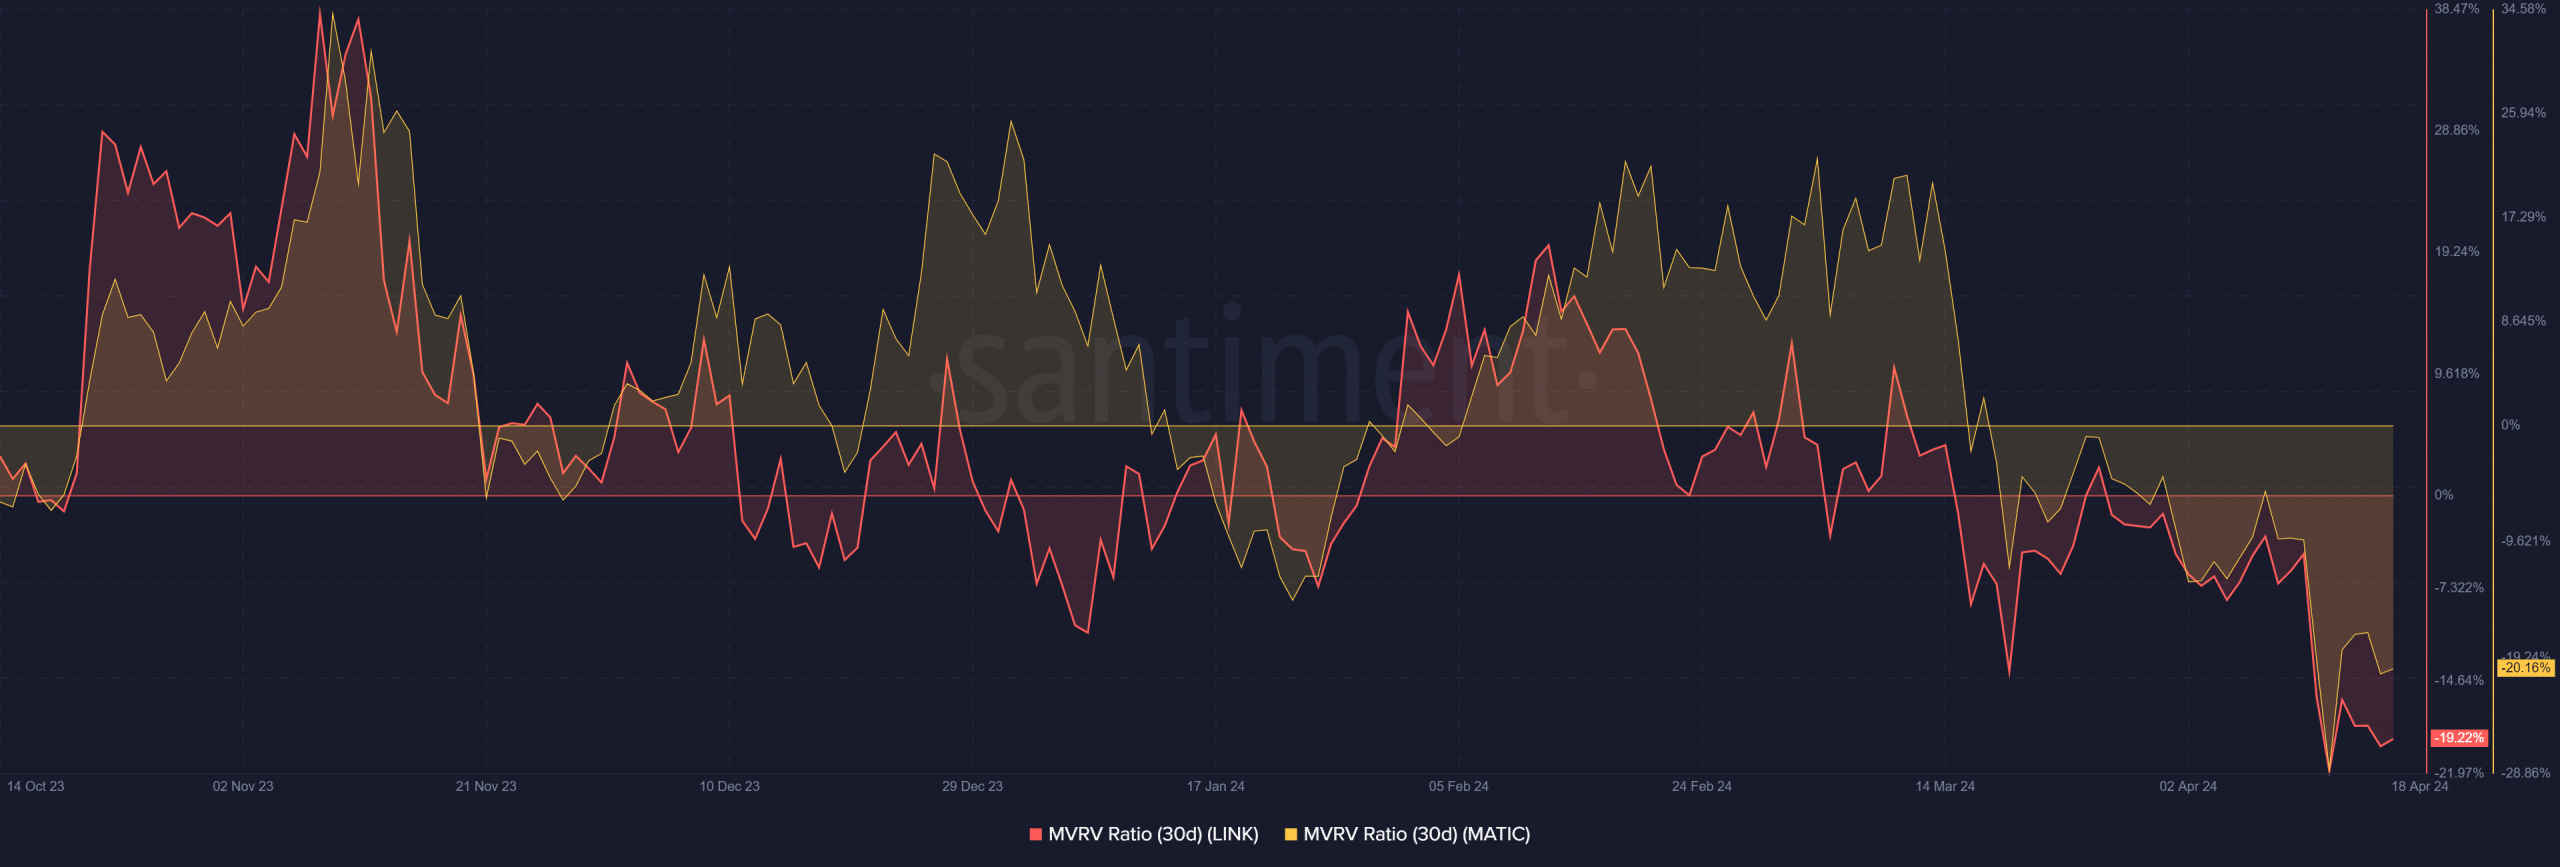
Analyzing the MVRVThe analysis of Chainlink’s 30-day MVRV revealed that it had been negative since the 26th of March, with the MVRV hovering around -20% at press time.
This indicated that holders during this period were experiencing nearly a 20% loss. In contrast, earlier in the year, around February, the MVRV reached as high as 11%.
Similarly, Polygon’s MVRV has been negative since the 17th of March, with the press time value around -19.6%. This suggested that buyers within this period face over a 19% loss, similar to LINK.
These negative MVRV values could signal forthcoming price corrections for both LINK and MATIC. The decline might also allow new traders to enter the market.
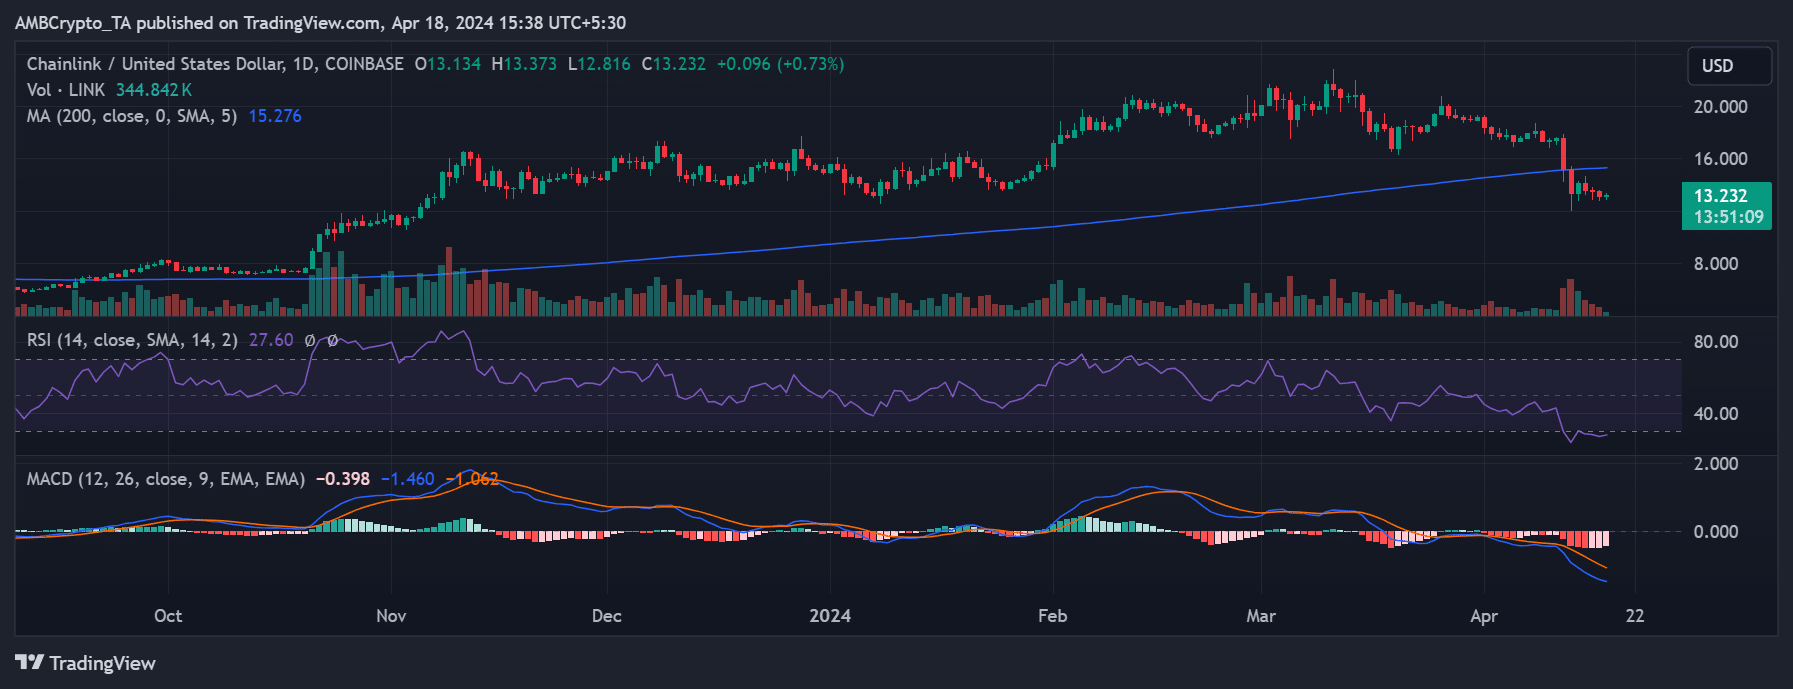
LINK and MATIC see consecutive declinesAMBCrypto’s analysis of LINK on a daily timeframe chart indicated that it was oversold at press time.
This conclusion is drawn from the Relative Strength Index (RSI) being below 30, suggesting a strong bear trend and oversold conditions.
This state may signal a potential price correction in line with its 30-day MVRV indication. At the time of writing, Chainlink was trading at around $13, with a slight price increase.
The chart also revealed three consecutive days of decline before this, resulting in a loss of over 6%.
MATIC was experiencing a similar trend. At the time of this writing, its RSI was below 30, indicating oversold conditions and a strong bear trend. It was trading around $0.6, with a slight decline observed.
This decline marked the fourth consecutive day of decline for MATIC. The long Moving Average (blue line) currently acts as resistance, reflecting the current poor price state.
Traders’ interest cools off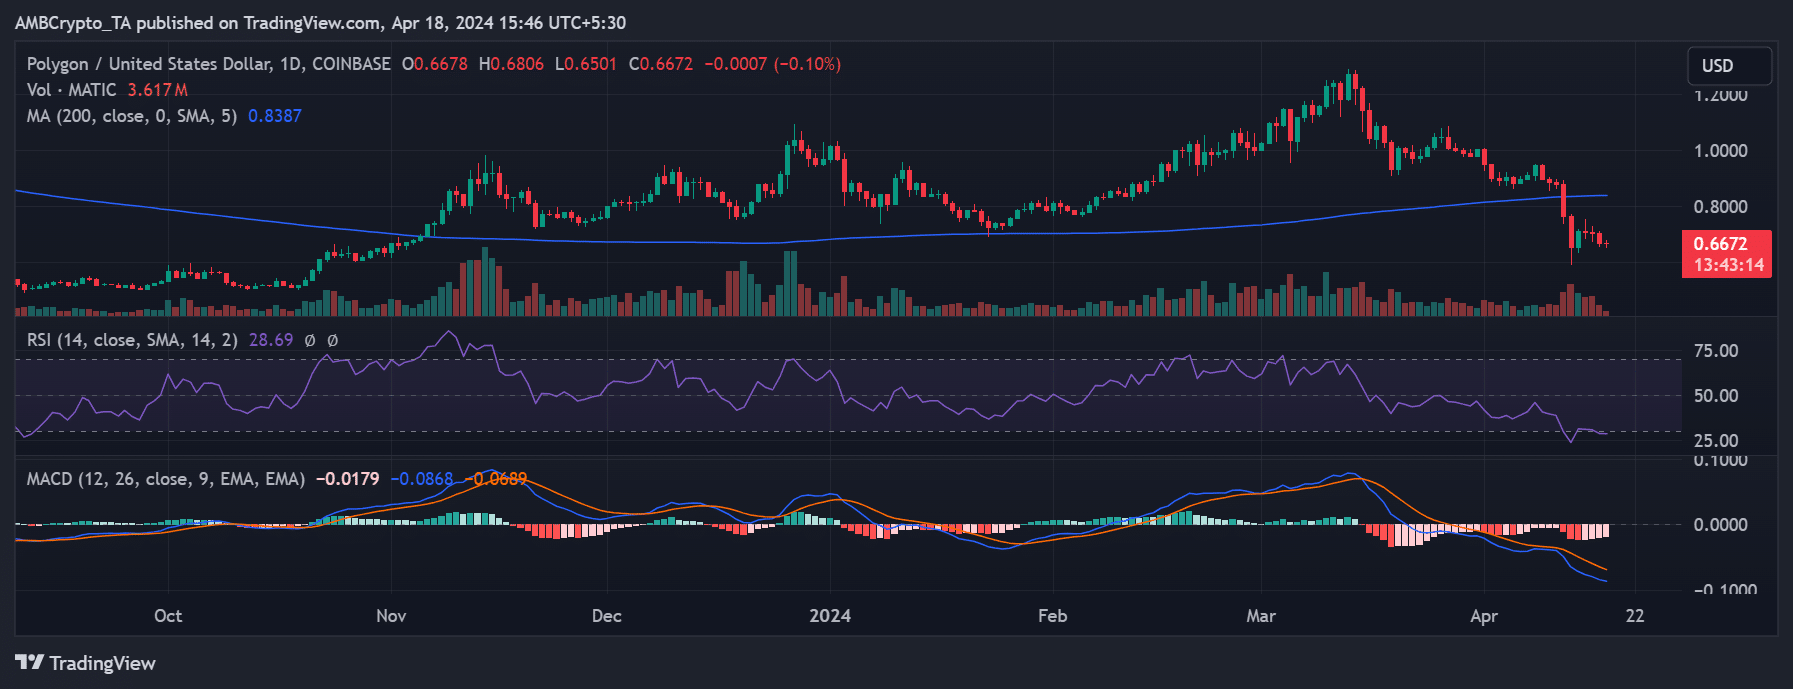
Analysis of Chainlink’s Open Interest on Coinglass indicated a reduction in interest over the past few days. The chart reveals a decrease of over $100 million between the beginning of the week and the present.
At the time of writing, the LINK Open Interest stood at around $164 million, down from the initial value of over $276 million at the start of the week.
Realistic or not, here’s LINK market cap in BTC’s terms
Similarly, Polygon’s Open Interest decreased by over $100 million during the same period.
At the time of this writing, the MATIC Open Interest was approximately $172 million, a decline from over $294 million at the beginning of the week. This suggests a decline in money flows into these assets.
read more